The Evolving Probability Distribution of Climate Extremes: Earth’s Energy Imbalance, Statistical Skewness, and Feedback Coupling in an Increasingly Energetic Climate System
Climate change is reshaping the probability distribution of extreme events, producing more frequent, intense, and interconnected hazards through nonlinear climate feedbacks.
2Independent Physicist, Membrane Institute, USA
July 4, 2026
Abstract
Global warming is often communicated through changes in average surface air temperature. While useful, this framing understates the fundamental driver of climate change: the accumulation and redistribution of excess thermal energy throughout the Earth system. Because more than 90% of anthropogenic excess heat is stored in the oceans, surface temperature alone provides only a partial representation of the climate system’s changing energy balance. We argue that conceptual illustrations of climate change should therefore be interpreted as probability distributions of total climate-system energy rather than simple temperature distributions. As Earth’s energy imbalance increases, the statistical distribution of climate outcomes evolves beyond a simple rightward shift. The distribution becomes increasingly skewed, with a broader and heavier upper tail corresponding to more frequent, more intense, and longer-duration extreme events. Simultaneously, individual hazards increasingly interact through nonlinear feedback coupling, producing compound and cascading extremes. These changes reflect the redistribution of excess thermal energy through atmospheric and oceanic processes rather than isolated changes in weather. Understanding climate change as an evolving probability distribution governed by Earth’s energy imbalance provides a more comprehensive framework for interpreting modern climate extremes.
1. Introduction
Climate change is frequently illustrated using a bell-shaped probability distribution in which warming shifts the distribution toward higher temperatures, increasing the likelihood of extreme heat events. Although this visualization effectively introduces the concept of changing probabilities, it risks oversimplifying the underlying physics.
The Earth’s climate is fundamentally governed by its energy balance. Anthropogenic greenhouse gases reduce outgoing longwave radiation, producing a persistent planetary energy imbalance. Most of this excess energy is not retained in the atmosphere but absorbed by the oceans, which currently store more than 90% of the additional heat accumulating in the climate system (von Schuckmann et al., 2023; IPCC, 2021).
Consequently, a conceptual continuum extending from lower to higher thermal energy more accurately represents climate-system evolution than one depicting air temperature alone. The atmosphere, oceans, cryosphere, biosphere, and land surface collectively exchange this stored energy through complex interactions that manifest as increasingly energetic weather events.
2. Earth’s Energy Imbalance as the Primary Climate Variable
Surface air temperature is an important diagnostic variable but represents only a small fraction of the total energy accumulating within the Earth system.
Recent observations indicate that the planetary energy imbalance has increased substantially over the satellite era (Loeb et al., 2021). Excess energy is partitioned approximately as follows:
| Reservoir | Approximate Fraction of Excess Heat |
|---|---|
| Oceans | >90% |
| Land | ~5% |
| Ice Melt | ~3% |
| Atmosphere | ~1% |
Because the oceans dominate planetary heat storage, climate evolution is fundamentally an energetic process rather than merely an atmospheric warming process.
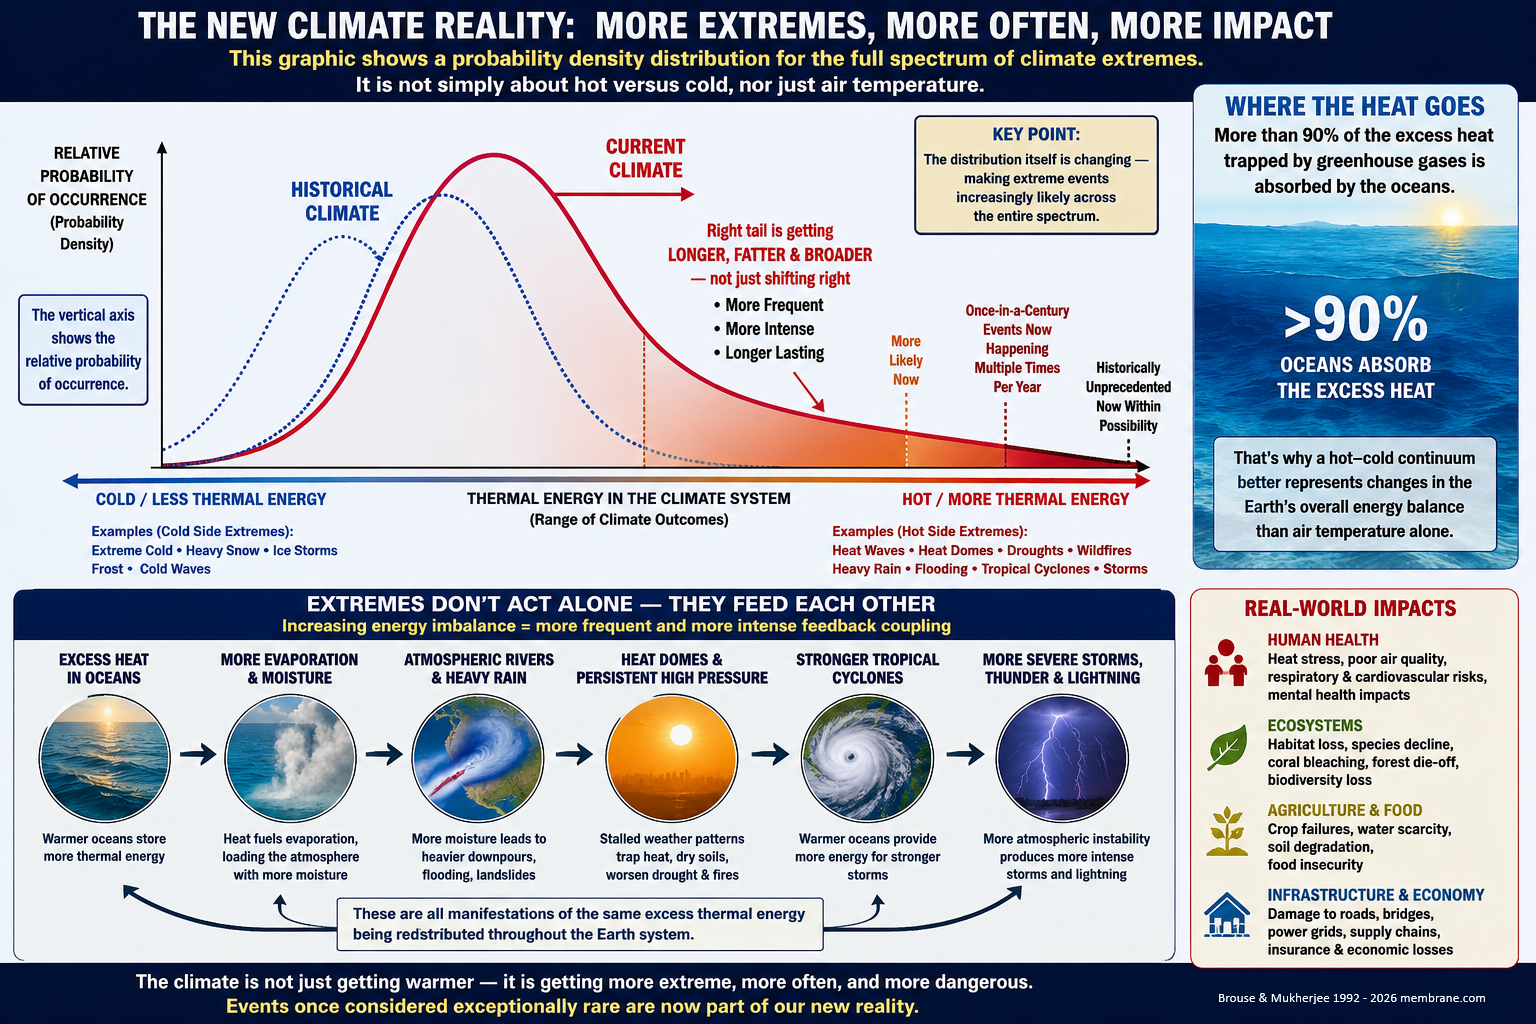
The horizontal axis in conceptual probability diagrams should therefore be interpreted as representing increasing Earth-system thermal energy, encompassing ocean heat content, atmospheric moisture, latent heat, and the energy available to drive weather systems.
3. Evolution of the Probability Distribution
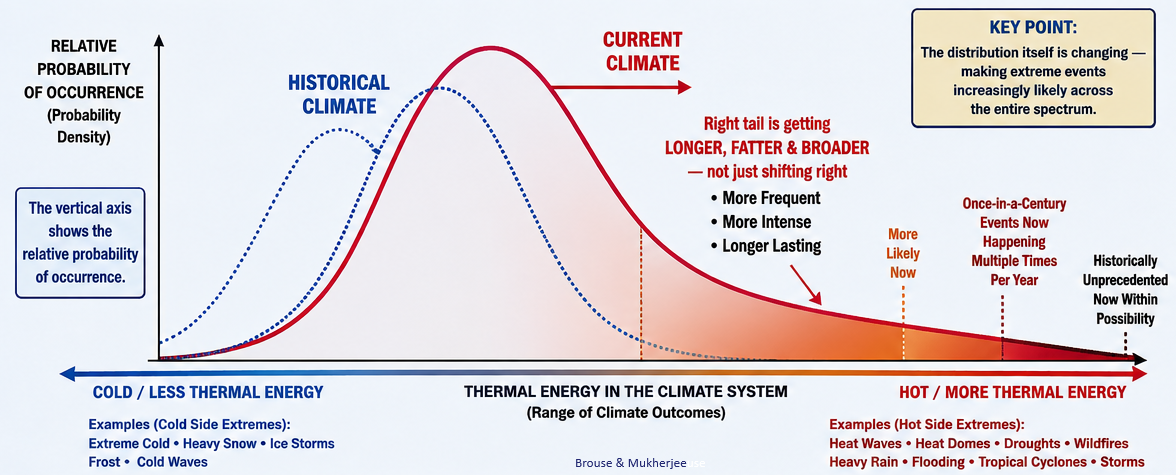
Traditional illustrations depict warming primarily as a rightward shift of a normal distribution.
However, observations increasingly indicate that the distribution itself is evolving.
Rather than simply translating toward warmer conditions, the upper tail is becoming:
- longer,
- broader,
- heavier,
- increasingly asymmetric.
Statistically, this reflects increasing positive skewness and changes in higher-order moments of the climate distribution.
The consequence is that events formerly located far within the statistical tail now occur substantially more often than predicted by historical climatology.
This evolution is consistent with attribution studies demonstrating rapidly increasing probabilities for extreme heat, heavy precipitation, marine heatwaves, and compound climate events (IPCC, 2021).
4. From Rare Extremes to Persistent Extremes
A critical consequence of distributional change is that climate extremes are no longer simply more intense.
They also persist longer.
Persistent blocking highs and heat domes illustrate this transition.
Recent heat events across North America and Europe have demonstrated that elevated temperatures sustained over many consecutive days produce disproportionately greater impacts than isolated hot days.
Long-duration heat increases:
- cumulative physiological stress,
- nighttime heat exposure,
- agricultural losses,
- wildfire potential,
- electrical demand,
- ecosystem mortality.
The probability distribution therefore evolves not only along the intensity axis but also along the temporal dimension.
Duration has become an equally important component of climate risk.
5. Probability Distributions Represent Climate Outcomes, Not Individual Weather Variables
The conceptual bell curve should not be interpreted as describing only hot versus cold weather.
Rather, it represents a simplified probability density distribution of climate outcomes.
The horizontal axis encompasses the full spectrum of possible climate states, while the vertical axis represents their relative probability of occurrence.
Individual manifestations include:
- heat waves,
- atmospheric rivers,
- tropical cyclones,
- drought,
- severe thunderstorms,
- flooding,
- wildfire weather,
- marine heatwaves,
- compound events.
Each reflects a different pathway through which excess thermal energy is redistributed throughout the coupled Earth system.
6. Feedback Coupling and Increasing System Connectivity
Perhaps the most important characteristic of the modern climate system is not simply increasing extremes but increasing interdependence among extremes.
Historically, many weather hazards could be treated as relatively independent processes.
As planetary energy accumulates, however, nonlinear interactions become increasingly common.
Examples include:
- Heat increases evaporation.
- Increased evaporation raises atmospheric moisture content.
- Greater moisture intensifies atmospheric rivers.
- Warmer oceans provide additional latent heat to tropical cyclones.
- Persistent blocking strengthens heat domes.
- Elevated instability increases severe convection and lightning.
- Drought increases wildfire probability.
- Wildfires increase atmospheric aerosols and carbon emissions.
- Ice loss reduces albedo, increasing additional heat absorption.
These interactions represent examples of feedback coupling, whereby one climate process amplifies another through interconnected physical mechanisms.
Rather than isolated hazards, modern climate extremes increasingly function as components of a dynamically coupled energetic system.
7. Earth’s Energy Redistribution
The planetary energy imbalance itself cannot be directly perceived.
Its consequences, however, are observable through increasingly energetic transfers of heat within the climate system.
These transfers manifest as:
- stronger atmospheric rivers,
- larger heat domes,
- heavier precipitation,
- more intense tropical cyclones,
- stronger thunderstorms,
- increased lightning,
- more persistent drought,
- expanded wildfire activity.
Each represents a different mechanism by which excess thermal energy is redistributed throughout the atmosphere-ocean system.
Viewed collectively, these events provide tangible evidence of an increasingly energetic climate.
8. Implications for Climate Communication
Public discussion frequently emphasizes average warming.
While scientifically accurate, averages obscure the statistical transformation occurring within climate variability.
The central message is therefore not simply that the planet is becoming warmer.
Rather, the probability distribution governing climate outcomes is itself evolving.
Extreme events once considered exceptionally rare now occur with increasing frequency, persist for longer durations, and produce substantially greater societal, ecological, and economic impacts.
Communicating climate change through the lens of Earth’s changing probability distribution provides a more complete understanding of modern climate dynamics than average temperature alone.
9. Conclusion
The defining characteristic of contemporary climate change is not simply rising global mean temperature, but the accumulation and redistribution of excess thermal energy throughout the coupled Earth system. Because the oceans absorb the overwhelming majority of this excess heat, Earth’s energy imbalance provides a more physically meaningful framework for understanding climate evolution than atmospheric temperature alone.
As this energy imbalance grows, the probability distribution of climate outcomes undergoes a fundamental transformation. The distribution does not merely shift toward warmer conditions; it becomes increasingly asymmetric, with a broader and heavier upper tail reflecting more frequent, more intense, and more persistent extreme events. At the same time, individual hazards are becoming progressively interconnected through nonlinear feedback coupling, allowing one extreme to amplify another across atmospheric, oceanic, terrestrial, and cryospheric systems.
Heat domes, atmospheric rivers, severe thunderstorms, tropical cyclones, droughts, floods, and wildfires should therefore be viewed not as isolated phenomena, but as diverse expressions of the same underlying energetic imbalance. Each represents a pathway through which excess thermal energy is redistributed across the Earth system. Interpreting climate change through this probabilistic and energetic framework provides a more comprehensive understanding of why extreme events are accelerating, why compound hazards are becoming increasingly common, and why climate impacts are intensifying faster than changes in global mean temperature alone would suggest.
Footnotes
- Earth’s Energy Imbalance (EEI) is defined as the difference between incoming absorbed solar radiation and outgoing longwave radiation at the top of the atmosphere. A positive imbalance indicates continued accumulation of heat within the climate system.
- Ocean heat content is widely regarded as the most robust measure of long-term planetary warming because it integrates the vast majority of excess thermal energy stored in the climate system.
- In statistical terms, a “heavier right tail” denotes an increased probability of extreme positive departures relative to a normal distribution. In climate science, this reflects a greater likelihood of unusually intense events than would be expected under historical climatic conditions.
- Feedback coupling refers to the interaction of two or more climate processes in which one process modifies another, producing amplification or attenuation. Positive feedback coupling can generate compound and cascading extremes that exceed the impacts of individual hazards.
References
Brouse, D., & Mukherjee, S. (2026). Climate Change Threshold-Driven Dynamics: A Unified State-Space Framework for Accelerating Earth System Energy Redistribution.
Intergovernmental Panel on Climate Change (IPCC). (2021). Climate Change 2021: The Physical Science Basis. Cambridge University Press.
Loeb, N. G., et al. (2021). Satellite and ocean data reveal marked increase in Earth’s heating rate. Geophysical Research Letters, 48(8), e2021GL093047.
Rohde, R. A., & Hausfather, Z. (2020). The Berkeley Earth land/ocean temperature record. Earth System Science Data, 12, 3469–3479.
Trenberth, K. E., Fasullo, J. T., & Balmaseda, M. A. (2014). Earth’s energy imbalance. Journal of Climate, 27(9), 3129–3144.
von Schuckmann, K., et al. (2023). Heat stored in the Earth system 1960–2020: Where does the energy go? Earth System Science Data, 15, 1675–1709.
World Meteorological Organization (2024). State of the Global Climate 2024. Geneva: WMO.
* Our probabilistic, ensemble-based climate model — which incorporates complex socio-economic and ecological feedback loops within a dynamic, nonlinear system — projects that global temperatures are becoming unsustainable this century. This far exceeds earlier estimates of a 4°C rise over the next thousand years, highlighting a dramatic acceleration in global warming. We are now entering a phase of compound, cascading collapse, where climate, ecological, and societal systems destabilize through interlinked, self-reinforcing feedback loops.
We examine how human activities — such as deforestation, fossil fuel combustion, mass consumption, industrial agriculture, and land development — interact with ecological processes like thermal energy redistribution, carbon cycling, hydrological flow, biodiversity loss, and the spread of disease vectors. These interactions do not follow linear cause-and-effect patterns. Instead, they form complex, self-reinforcing feedback loops that can trigger rapid, system-wide transformations — often abruptly and without warning. Grasping these dynamics is crucial for accurately assessing global risks and developing effective strategies for long-term survival.