A New Way to Understand Earth’s Accelerating Climate System: Climate Change Threshold-Driven Dynamics
Public Access Edition
“This looks complicated.” True—it is complicated, and that’s part of the problem. The climate system involves interacting feedbacks across the atmosphere, oceans, biosphere, and cryosphere, so it can’t really be reduced to a single mechanism or slogan without losing important detail.
That’s exactly why we created this version as a public-access summary (roughly 6th–10th grade level)—to make the core ideas more accessible without requiring technical background.
But at the simplest level, the takeaway is straightforward: burning fossil fuels is driving the problem, and reducing those emissions is the most direct way to limit further warming and related impacts.
Daniel Brouse¹ and Sidd Mukherjee²
July 2026
¹Independent Climate Researcher, Economist
²Physicist
Executive Summary
For decades, climate change has often been described as a slow, gradual process. Rising temperatures, melting ice, and increasing sea levels were expected to unfold steadily over many generations.
That picture is changing.
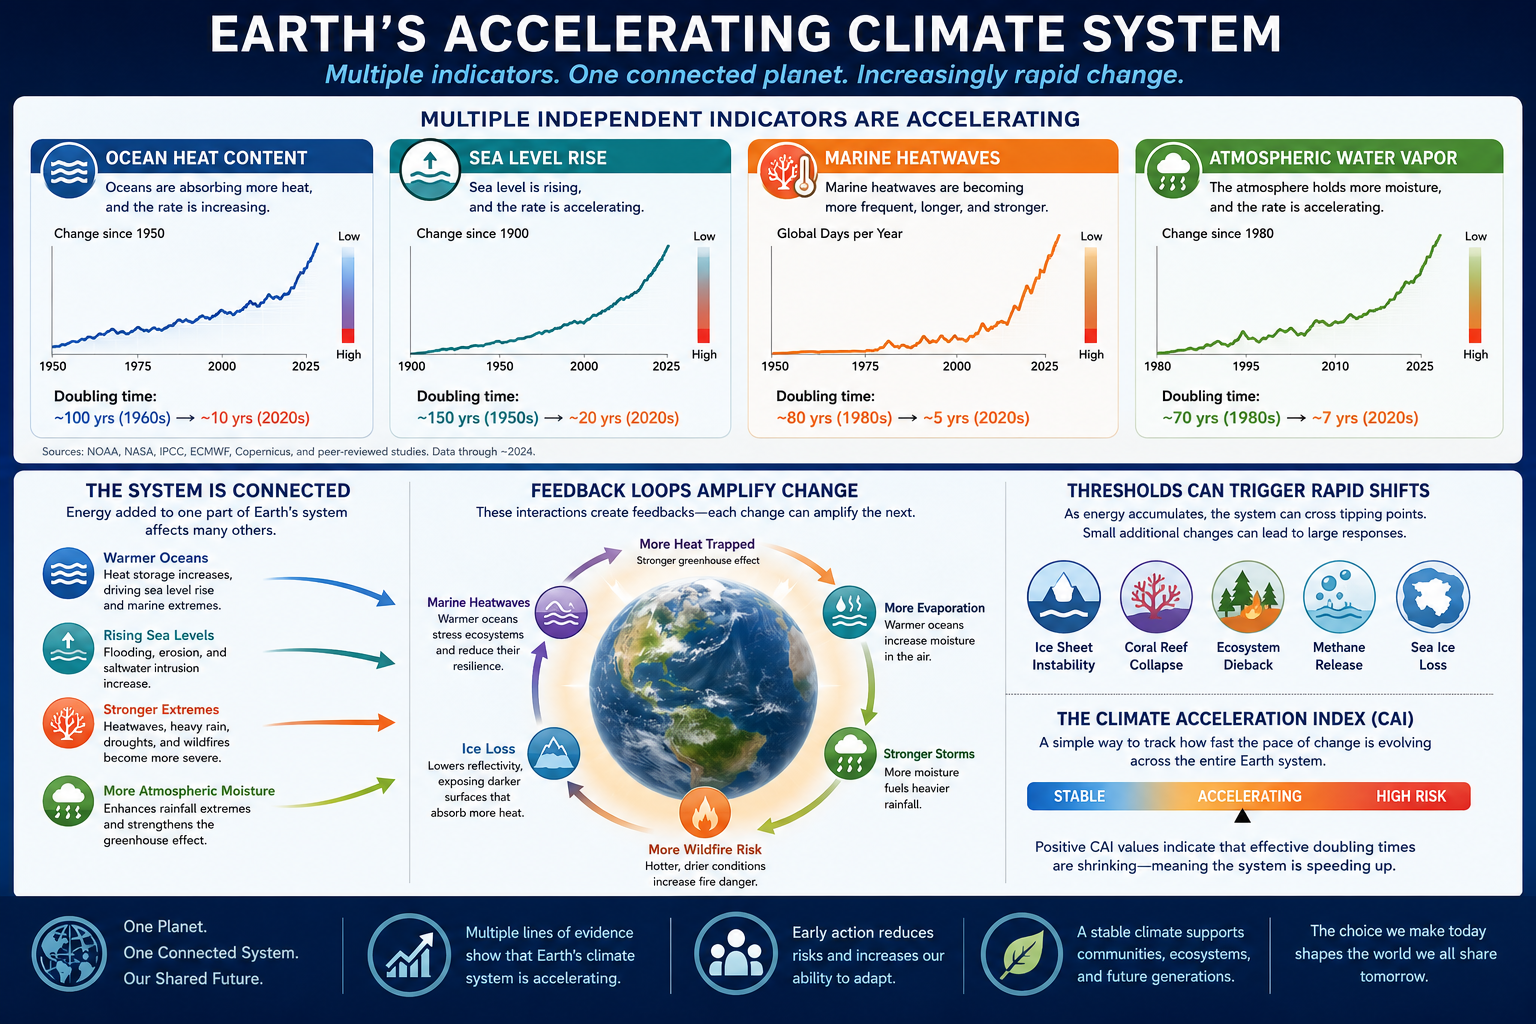
Evidence from multiple independent observations now suggests that many parts of Earth’s climate system are no longer changing at constant rates. Instead, the rates of change themselves are increasing.
This distinction is important.
Instead of asking:
“How fast is sea level rising?”
we should increasingly ask:
“Is sea level rise itself speeding up?”
The same question applies to ocean warming, atmospheric moisture, marine heatwaves, wildfire conditions, and many other parts of the climate system.
This paper introduces a framework for examining the climate system as a single interconnected network whose major components exchange energy and reinforce one another through feedback loops. Rather than viewing each indicator independently, the framework evaluates how the entire system evolves together.
From Linear Change to Accelerating Change
Many natural systems change gradually.
Imagine driving a car at a constant speed.
Now imagine continually pressing the accelerator.
The difference is not simply that the car is moving—it is that the speed itself is increasing.
Earth’s climate increasingly appears to behave in the second way.
For much of the industrial era, many climate indicators changed relatively slowly.
Today, numerous observations show that several major Earth system components are accelerating simultaneously.
These include:
- Ocean Heat Content
- Global Sea Level
- Marine Heatwaves
- Atmospheric Water Vapor
Each represents a different part of Earth’s energy system, yet all respond to the same underlying planetary energy imbalance.
The Climate System Is Connected
Earth does not contain isolated climate systems.
Everything interacts.
As oceans absorb more heat:
- seawater expands, raising sea levels
- evaporation increases
- atmospheric moisture rises
- heavier rainfall becomes possible
- marine heatwaves intensify
- glaciers melt faster
- ecosystems experience greater stress
These interactions create feedbacks.
A feedback occurs when one change amplifies another.
For example:
Ocean warming → More evaporation → More atmospheric water vapor → Stronger greenhouse trapping → Additional ocean warming
Each loop reinforces the next.
Instead of separate problems, these become parts of one larger system.
Why Doubling Times Matter
One useful way to understand acceleration is through doubling time.
Doubling time asks:
How long would it take for today’s value to double if the current rate continued?
If the doubling time becomes shorter, change is accelerating.
For example:
| Doubling Time | Interpretation |
|---|---|
| 100 years | Slow change |
| 50 years | Changing faster |
| 25 years | Acceleration increasing |
| 10 years | Rapid acceleration |
Shrinking doubling times indicate that the climate system is evolving more quickly than before.
They provide an intuitive way to compare very different climate indicators using a common measure.
Familiar Example
Many people are familiar with the power of compound interest. Historically, a diversified stock portfolio has returned about 10% per year over long periods (although actual returns vary from year to year).
At a 10% annual return, an investment doubles approximately every 7.2 years (using the Rule of 72).
FV=PV(1+r)n
Suppose you invest $10,000 at age 18 and leave it untouched until age 64—a period of 46 years.
Using annual compounding:FV=$10,000×(1.10)46 FV≈$803,731
That’s an increase by a factor of 80.4×.
Another way to see it is through doubling times:
- Age 18: $10,000
- Age 25 (1st doubling): $20,000
- Age 32 (2nd): $40,000
- Age 39 (3rd): $80,000
- Age 46 (4th): $160,000
- Age 53 (5th): $320,000
- Age 60 (6th): $640,000
- Age 64: About $804,000 (another four years of 10% growth beyond the sixth doubling)
This illustrates an important concept: the investment isn’t growing by the same dollar amount each year—it is growing by the same percentage. As the principal becomes larger, each year’s gain becomes dramatically larger than the previous year’s.
The compound interest example demonstrates why shrinking doubling times are so powerful. At a steady 10% annual return, an investment doubles about every seven years, allowing $10,000 to grow into more than $800,000 over a lifetime through the relentless mathematics of exponential growth. Climate change, however, may be even more concerning because the Earth’s effective doubling times are not remaining constant—they appear to be shrinking. In financial terms, it would be as if your investment initially doubled every 10 years, then every 5 years, then every 2 years, and eventually almost instantaneously. Each shortening of the doubling time means the system is accelerating, producing increasingly larger changes over increasingly shorter periods. As climate feedbacks strengthen, the accumulation and redistribution of energy through the oceans, atmosphere, ice sheets, and ecosystems can occur at an ever-faster pace. Just as investors celebrate faster compounding because it rapidly multiplies wealth, accelerating climate doubling times mean that warming, sea-level rise, extreme weather, and ecosystem disruption can compound much more quickly than linear thinking would suggest. The critical insight is not simply that the climate is changing, but that the pace of change itself is accelerating. In the limit, as the doubling time approaches zero, the system transitions toward an instantaneous-growth regime, where the characteristic timescale of change collapses and the climate system can respond far more rapidly than historical experience would suggest.
This is analogous to accelerating climate change. The Earth’s energy imbalance acts like the “interest rate.” If climate feedbacks strengthen over time, the effective growth rate increases and the doubling time shrinks. Just as a shortening doubling time makes an investment grow much faster, shrinking climate-system doubling times mean that changes in ocean heat, sea level, atmospheric moisture, and extreme events can accelerate much more rapidly than they did in previous decades.
A Shift Toward Threshold-Driven Dynamics
Many natural systems contain thresholds.
A bridge can withstand increasing weight until one additional truck causes failure.
A forest may tolerate drought for years before widespread wildfire suddenly erupts.
Ice sheets may melt slowly until structural weakening causes much faster ice loss.
Climate systems often behave similarly.
Energy accumulates gradually until internal stability begins to weaken.
Once thresholds are approached, relatively small additional warming can produce disproportionately large responses.
Scientists call this nonlinear behavior.
Instead of smooth change, the system begins responding through rapid jumps, stronger feedbacks, and cascading interactions.
Introducing the Climate Acceleration Index
To better understand this behavior, we introduce a simple concept called the Climate Acceleration Index (CAI).
Rather than measuring how large a climate variable becomes, the CAI measures how rapidly the pace of change itself is evolving.
Positive values indicate that effective doubling times are shrinking.
In plain language:
- the system is speeding up
- climate responses are occurring over shorter time scales
- feedbacks are becoming increasingly important
The Climate Acceleration Index is intended as a system-wide diagnostic rather than a forecast.
Viewing the Entire Earth System
Traditional climate graphs usually display one variable at a time:
- global temperature
- sea level
- ocean heat
- Arctic ice
- atmospheric carbon dioxide
Each tells an important story.
But because Earth’s climate behaves as a connected network, examining only individual indicators can miss broader system behavior.
This framework instead evaluates how multiple components evolve together.
When several independent indicators accelerate simultaneously, they provide stronger evidence of coordinated changes throughout the Earth system.
Why This Matters
As the climate system accelerates:
- extreme rainfall becomes more likely
- marine heatwaves become more persistent
- stronger tropical cyclones become more probable
- wildfire conditions become increasingly favorable
- droughts intensify
- flooding becomes more frequent
- ecosystem stress increases
None of these processes occur in isolation.
They emerge from the same planetary energy imbalance interacting through multiple feedback mechanisms.
A New Perspective
Historically, climate science has focused on answering questions such as:
- How much warmer is the planet?
- How much higher is sea level?
- How often do heatwaves occur?
These remain essential.
However, a new question is becoming increasingly important:
How quickly are the rates of change themselves evolving?
Answering this question helps identify whether Earth’s climate is entering a different dynamical regime—one increasingly governed by interacting feedbacks rather than relatively steady trends.
Conclusion
Earth’s climate is best understood not as a collection of independent trends but as an interconnected system continually redistributing energy.
As that redistribution accelerates, multiple climate indicators increasingly change together.
Shrinking doubling times provide one way to observe this transition.
The Climate Acceleration Index offers a framework for monitoring whether the Earth’s major subsystems are moving toward faster, more tightly coupled behavior.
This approach does not replace traditional climate indicators.
Instead, it complements them by focusing on the evolution of the entire system rather than any single variable.
As climate feedbacks strengthen, understanding the behavior of the whole system may become just as important as measuring its individual parts.
Key Takeaways
- Earth is warming through an interconnected network of climate processes.
- Multiple climate indicators are accelerating simultaneously.
- Shrinking doubling times provide evidence that changes are occurring more rapidly.
- Thresholds and feedbacks can amplify future changes beyond simple linear expectations.
- The Climate Acceleration Index is a new framework designed to measure how rapidly the pace of climate change itself is evolving across the entire Earth system.
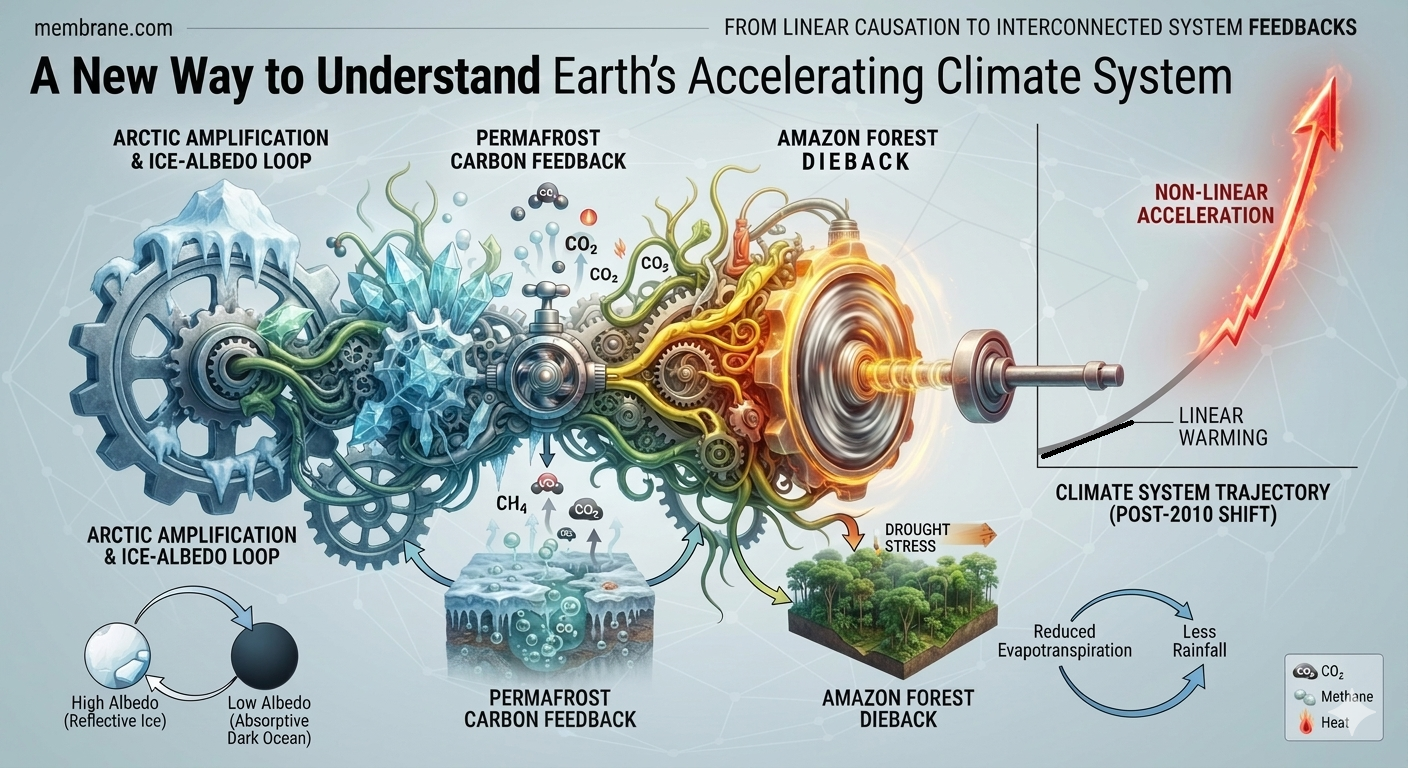
* Our probabilistic, ensemble-based climate model — which incorporates complex socio-economic and ecological feedback loops within a dynamic, nonlinear system — projects that global temperatures are becoming unsustainable this century. This far exceeds earlier estimates of a 4°C rise over the next thousand years, highlighting a dramatic acceleration in global warming. We are now entering a phase of compound, cascading collapse, where climate, ecological, and societal systems destabilize through interlinked, self-reinforcing feedback loops.
We examine how human activities — such as deforestation, fossil fuel combustion, mass consumption, industrial agriculture, and land development — interact with ecological processes like thermal energy redistribution, carbon cycling, hydrological flow, biodiversity loss, and the spread of disease vectors. These interactions do not follow linear cause-and-effect patterns. Instead, they form complex, self-reinforcing feedback loops that can trigger rapid, system-wide transformations — often abruptly and without warning. Grasping these dynamics is crucial for accurately assessing global risks and developing effective strategies for long-term survival.
Feedback Loops → Acceleration → Tipping Points → Acceleration → Domino Effect
Feedback loops amplify climate change and can push interconnected Earth systems past critical tipping points. As tipping points are crossed, they can trigger additional feedback loops and destabilize other climate systems. This cascading "Domino Effect" compresses timescales, accelerates change, and increases the risk of rapid, nonlinear climate transformations.References
-
Earth System State-Space Framework (unpublished manuscript)
Description: Development of a coupled state-space representation of Earth system observables including Ocean Heat Content (OHC), Sea Level Rise (SLR), Marine Heatwaves (MHW), and Atmospheric Water Vapor (AWV).
Key concepts: X(t), k_i(t), instantaneous doubling time Td,i(t), and coupling operator K(t). -
Ocean Heat Content (OHC) Observational Datasets
Source: NOAA National Centers for Environmental Information (NCEI)
Description: Global ocean heat content time series used for estimating energy accumulation in the climate system.
URL: https://www.ncei.noaa.gov/ -
Sea Level Rise (SLR) Observations
Source: NASA Sea Level Change Team
Description: Satellite altimetry-based global mean sea level records used for trend and acceleration analysis.
URL: https://sealevel.nasa.gov/ -
Marine Heatwave Metrics
Source: Hobday et al. framework; NOAA Coral Reef Watch
Description: Definition and detection algorithms for marine heatwave intensity, duration, and frequency.
URL: https://coralreefwatch.noaa.gov/ -
Atmospheric Water Vapor Observations
Source: NASA MODIS / AIRS / reanalysis products
Description: Satellite and reanalysis-based estimates of atmospheric moisture content and variability.
URL: https://earthdata.nasa.gov/ -
Nonlinear Climate Dynamics and Feedback Systems
Source: Peer-reviewed climate dynamics literature (general)
Description: Theoretical and empirical studies on nonlinear feedbacks, tipping points, and coupled Earth system behavior. -
Dynamical Systems and Stability Theory
Source: Standard mathematical physics literature
Description: Eigenvalue stability analysis, Jacobian matrices K(t), and interpretation of Re(λmax) in dynamical systems.
Additional References
IPCC (2023). Sixth Assessment Report
Lenton, T. et al. (2019). Climate tipping points
Hansen, J. et al. (2016). Ice melt and sea level rise
NOAA National Centers for Environmental Information. Billion-Dollar Weather and Climate Disasters Database
- A Unified Energetics Framework for Accelerating Climate Change: From Radiative Forcing to Drag Physics — Brouse and Mukherjee (March 2026)
- Emergent Climate Dynamics: The Nonlinear Acceleration of Climate Impacts — Brouse and Mukherjee (March 2026)
- The Third Derivative and Climate Acceleration: Why Change Is Increasing Faster Over Time — Brouse (March 2026)
- Case Study: Climate Coupling and Hidden Economic Costs — Brouse (March 2026)
- How Not to Be a Jerk: Third Derivatives and the Singularity of Climate Change — Brouse and Mukherjee (March 2026)
Further References
Primary Sources
Brouse, D., & Mukherjee, S. (2026). 2026: Observational Evidence for Climate Jerk: Multidisciplinary Indicators of Accelerating Climate Acceleration. Membrane.com Climate Science Series. Retrieved from http://membrane.com/global_warming/Climate-Jerk-Top-Indicators.html
Brouse, D., & Mukherjee, S. (2026). 2026: Confirmation of Nonlinear Climate Acceleration in the Arctic–North Atlantic System. Membrane.com Climate Science Series. Retrieved from http://membrane.com/global_warming/Nonlinear-Climate-Acceleration.html
Brouse, D., & Mukherjee, S. (2026). Amazon Rainforest Dieback: Emerging Risks, Feedback Loops, and Scenario-Based Projections. Membrane.com Climate Science Series. Retrieved from http://membrane.com/global_warming/Amazon-Dieback.html
Brouse, D., & Mukherjee, S. (2026). A Unified Energetics Framework for Accelerating Climate Change: From Radiative Forcing to Drag Physics. Membrane.com Climate Science Series. Retrieved from http://membrane.com/global_warming/Climate-Change-Math-and-Physics.html
Brouse, D., & Mukherjee, S. (2026). Is Climate Change on a Runaway Train?. Membrane.com Climate Science Series. Retrieved from http://membrane.com/global_warming/Climate-Runaway-Train-Scenario.html
Hansen and Colleagues
Hansen, J. E. (2025). Runaway Climate: The Point of No Return. Climate Science, Awareness and Action Newsletter. Retrieved from https://mailchi.mp/caa/runaway-climate-the-point-of-no-return
Hansen, J. E., Kharecha, P., Morgan, P., et al. (2025). Global Warming Acceleration: Impact on Sea Ice. Retrieved from http://membrane.com/global_warming/notes/SeaIce-Acceleration-02April2025.pdf
Hansen, J. E., Kharecha, P., & Morgan, P. (2025). Warning! This "Colorful Chart" is Censored by IPCC. Retrieved from http://membrane.com/global_warming/notes/Hansen-Acceleration-2025.pdf
Peer-Reviewed Literature
Baldwin, M. P., et al. (2021). Climate system variability and atmospheric circulation changes. Reviews of Geophysics, 59(1).
Caesar, L., McCarthy, G. D., Thornalley, D. J. R., Cahill, N., & Rahmstorf, S. (2021). Current Atlantic Meridional Overturning Circulation weakest in the last millennium. Nature Geoscience, 14, 118–120.
Francis, J. A., & Vavrus, S. J. (2012). Evidence linking Arctic amplification to extreme weather in mid-latitudes. Geophysical Research Letters, 39(6).
IMBIE Team. (2020). Mass balance of the Greenland Ice Sheet from 1992–2018. Nature, 579, 233–239.
Khan, S. A., Aschwanden, A., Bjørk, A. A., et al. (2016). Greenland ice sheet mass balance and sea-level contribution. Science Advances, 2(11), e1600931.
Mann, M. E., Rahmstorf, S., Kornhuber, K., et al. (2017). Influence of anthropogenic climate change on planetary wave resonance and extreme weather events. Scientific Reports, 7, 45242.
Overland, J. E., Hanna, E., Hanssen-Bauer, I., et al. (2019). The urgency of Arctic climate change. Nature Climate Change, 9, 181–184.
Serreze, M. C., & Barry, R. G. (2011). Processes and impacts of Arctic amplification. Global and Planetary Change, 77(1–2), 85–96.
Svennevig, K., et al. (2023). Climate-driven slope failures and cryosphere destabilization in Greenland. Geophysical Research Letters, 50.
Major Assessments and Data Sources
IPCC. (2021). Climate Change 2021: The Physical Science Basis. Contribution of Working Group I to the Sixth Assessment Report. Cambridge University Press.
NASA. (2025). Global Mean Sea Level from Satellite Altimetry. National Aeronautics and Space Administration. Retrieved from https://sealevel.nasa.gov
National Oceanic and Atmospheric Administration (NOAA). (2025). Climate Indicators and Global Monitoring Data. Retrieved from https://www.noaa.gov
World Meteorological Organization (WMO). (2024). State of the Global Climate 2024. Geneva, Switzerland.
Copernicus Climate Change Service (C3S). (2025). Global Climate Highlights. European Union.
Additional Recent Literature Relevant to Nonlinear Climate Dynamics
Armstrong McKay, D. I., Staal, A., Abrams, J. F., et al. (2022). Exceeding 1.5°C global warming could trigger multiple climate tipping points. Science, 377(6611), eabn7950.
Boers, N. (2021). Observation-based early-warning signals for a collapse of the Atlantic Meridional Overturning Circulation. Nature Climate Change, 11, 680–688.
Lenton, T. M., Rockström, J., Gaffney, O., et al. (2019). Climate tipping points—too risky to bet against. Nature, 575, 592–595.
Ripple, W. J., Wolf, C., Gregg, J. W., et al. (2024). The 2024 State of the Climate Report: Perilous Times on Planet Earth. BioScience.
Steffen, W., Rockström, J., Richardson, K., et al. (2018). Trajectories of the Earth System in the Anthropocene. Proceedings of the National Academy of Sciences, 115(33), 8252–8259.
Richardson, K., Steffen, W., Lucht, W., et al. (2023). Earth beyond six of nine planetary boundaries. Science Advances, 9(37), eadh2458.