Anthropogenic Global Warming 101
A Primer on Physics, Evidence, and Acceleration
Q: How fast is climate change accelerating?
A: From the Industrial Revolution through the 1990s, key climate-acceleration indicators appear to have doubled on timescales closer to a century. Today, many major warming-related impacts are doubling on timescales closer to a decade.
In effect, the leading indicators suggest an approximately 2^6-fold compression in doubling times — a dramatic acceleration in the pace of change. Multiple climate indicators now point to rates of warming-related disruption far beyond those observed during the modern instrumental era and potentially beyond much of the geological record.
This is not merely rapid climate change. If sustained, this may represent one of the most abrupt large-scale climate transitions in Earth’s recent geological history.
Daniel Brouse, Sidd Mukherjee, and Rocky Rex
2026
Introduction
This is a foundational course in anthropogenic climate change. It is not ideological, political, or partisan. It is based on established principles of physics, chemistry, and observational evidence from across the Earth system.
At the conclusion of the course, there will be a short test to review the key concepts presented.
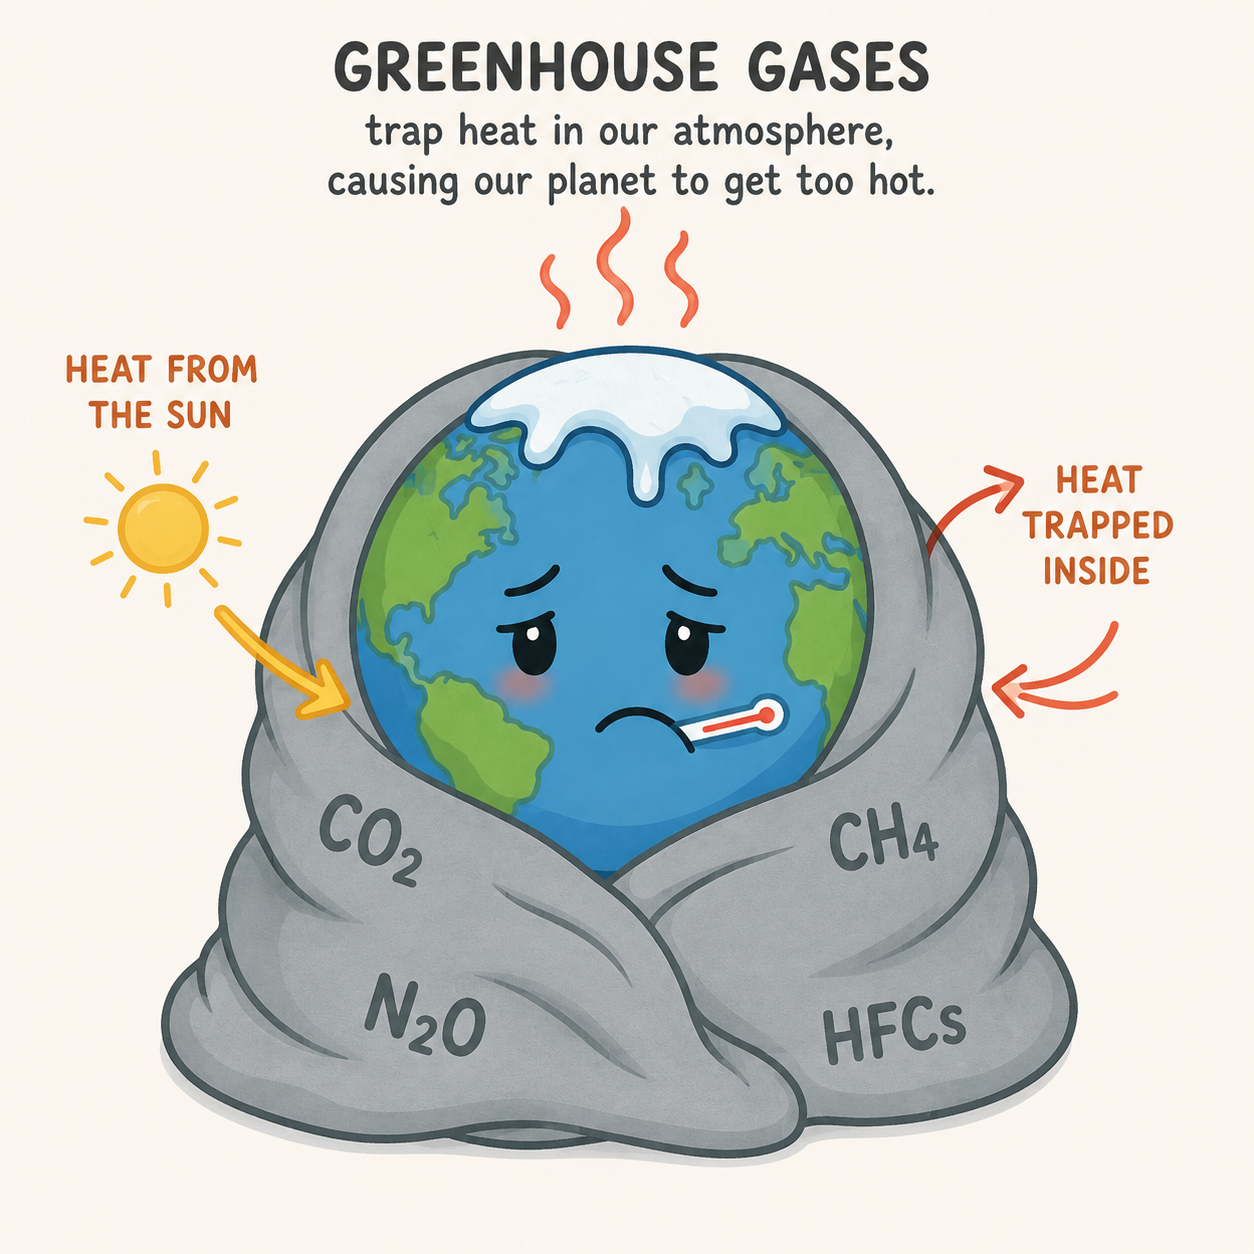
The primary driver of modern global warming is the increase in greenhouse gases released through human activities, especially the burning of fossil fuels. Carbon dioxide (CO2) and other greenhouse gases act like an insulating layer in the atmosphere, absorbing and re-emitting infrared radiation. This slows the loss of heat from Earth to space, creating an energy imbalance that causes the planet to warm.
1. What Is the Cause of Anthropogenic Climate Change?
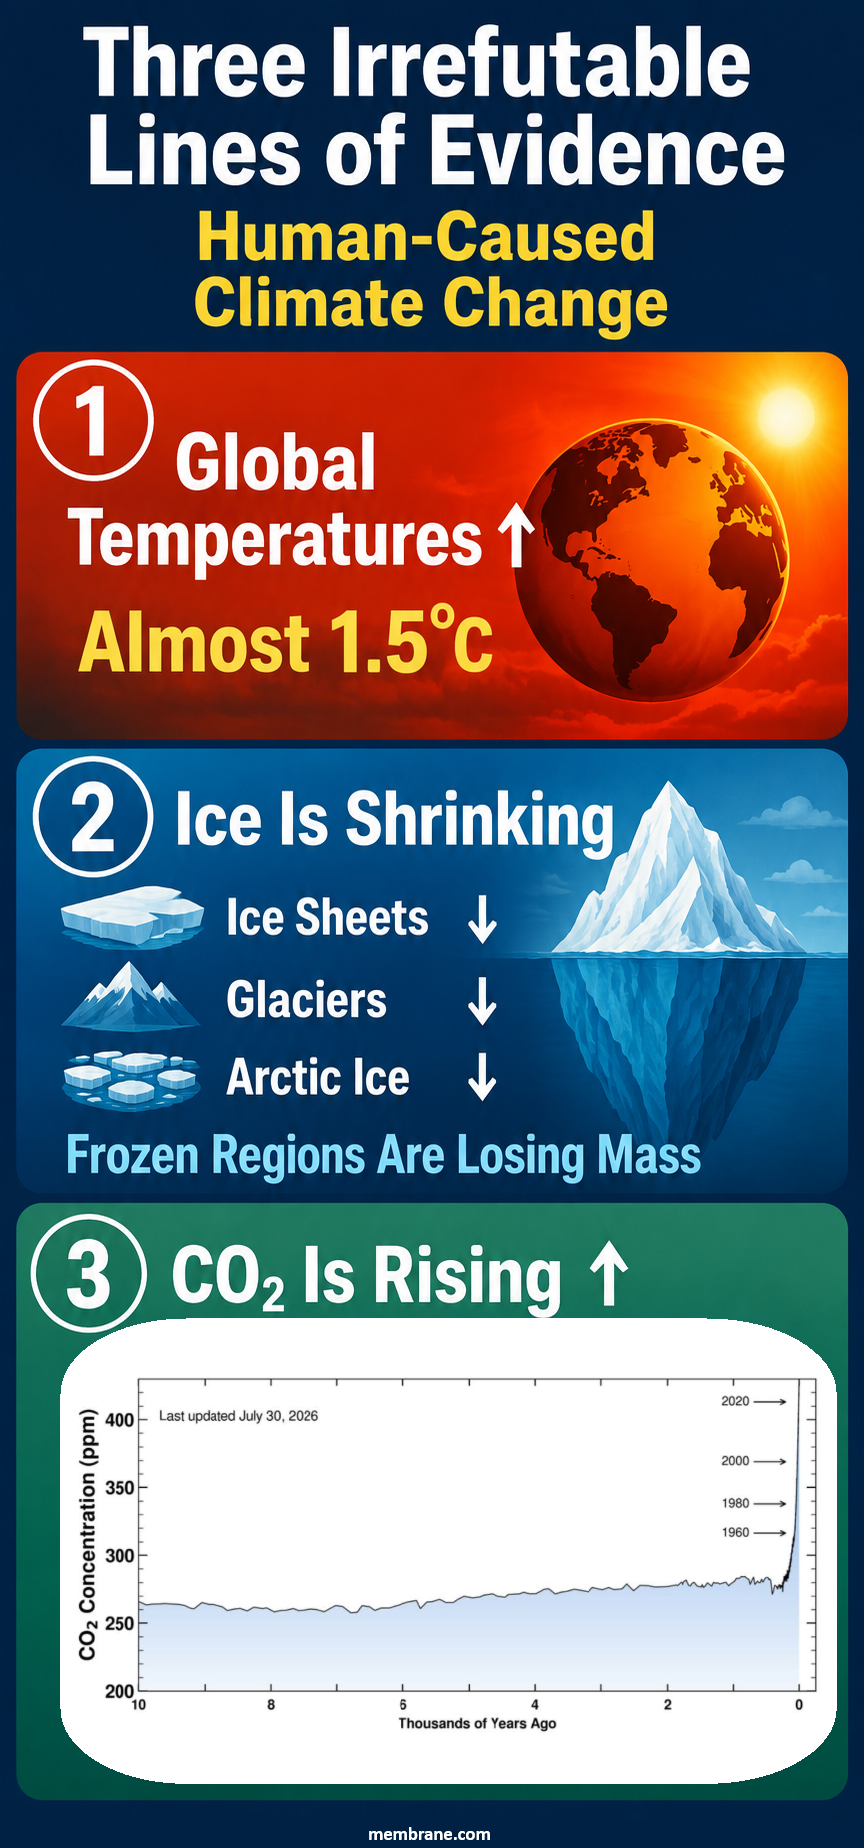
Answer: Humans.
More specifically, the rapid increase in atmospheric greenhouse gases resulting from industrial activity since the mid-19th century.
2. How Do Humans Cause Climate Change?
Primarily through the combustion of fossil fuels (coal, oil, natural gas), which releases carbon that has been sequestered underground for hundreds of millions of years.
Additional contributors include:
- Large-scale land-use change and deforestation
- Industrial agriculture
- Methane emissions from fossil extraction and livestock
- Cement production
- Mass consumer consumption patterns
- Depletion and combustion of finite carbon reservoirs
The key mechanism is simple: increasing atmospheric greenhouse gas concentrations alters Earth’s radiative balance.
3. Can Anthropogenic Global Warming Be Proven?
Yes.
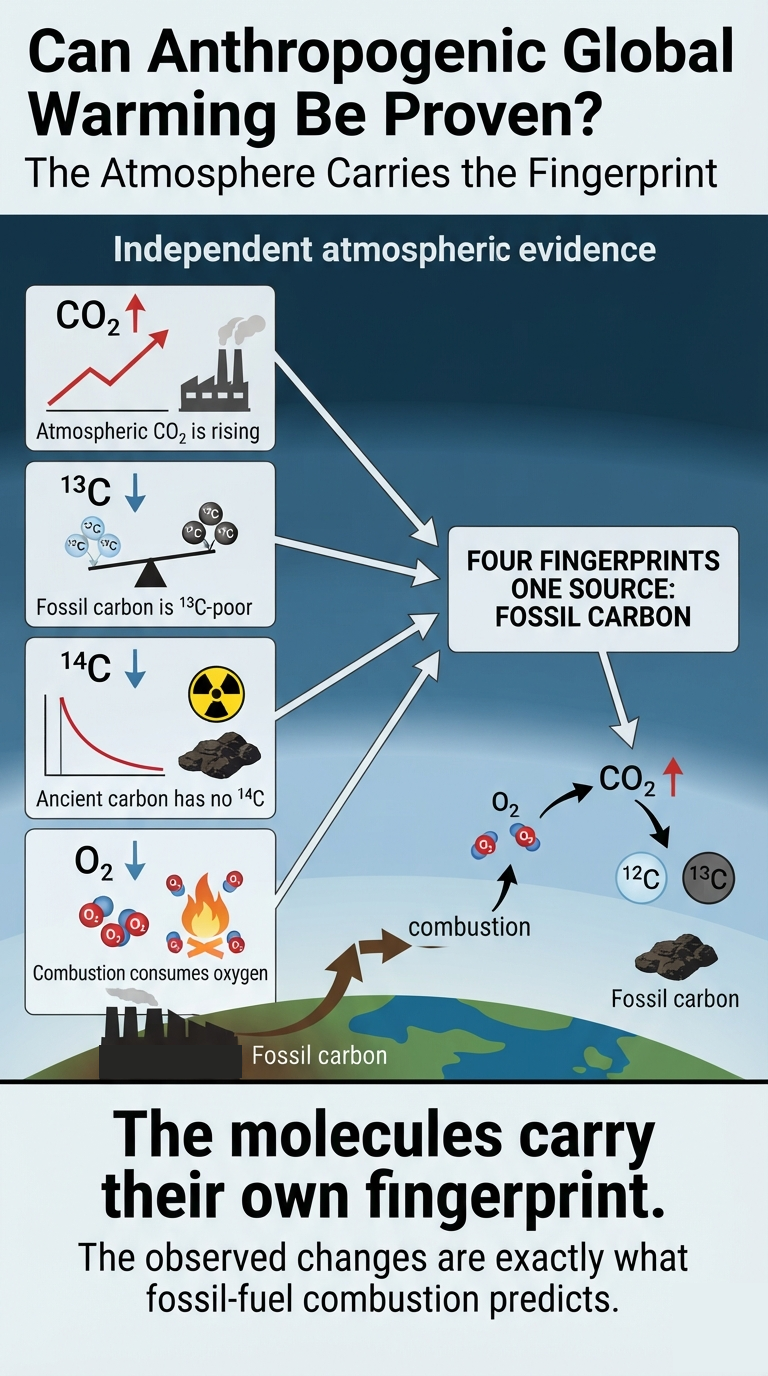
The isotopic signature of atmospheric carbon dioxide provides direct evidence.
Fossil carbon is depleted in 13C and contains essentially no measurable ¹⁴C (radiocarbon), because ¹⁴C decays over thousands of years.
Observed atmospheric trends show:
- A measurable decline in the 13C/12C ratio
- A measurable decline in atmospheric ¹⁴C concentration
- A measurable decline in atmospheric O2 concentration
These shifts form a remarkably consistent fingerprint.
The carbon isotopes tell us where the additional carbon is coming from. Fossil fuels were formed from ancient biological material and therefore have a characteristic isotopic signature: relatively little 13C and virtually no 14C. As fossil carbon is added to the atmosphere, the atmospheric CO2 isotope ratios shift in precisely the direction expected from fossil-fuel combustion.
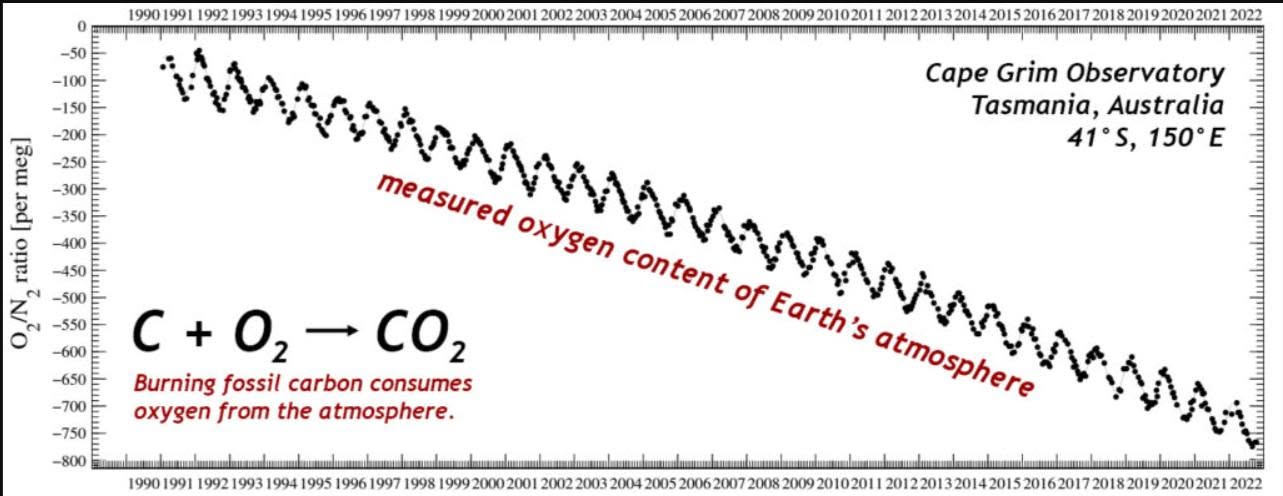
The decline in atmospheric oxygen provides an independent piece of evidence.
When fossil fuels are burned, carbon combines with atmospheric oxygen:
C + O2 → CO2
The process consumes O2 and produces CO2. Because the additional atmospheric CO2 is accompanied by a measurable decline in atmospheric O2, the observations are consistent with large-scale combustion of carbon rather than simply a redistribution of carbon through the natural carbon cycle.
This is especially important because the ocean, vegetation, and atmosphere continuously exchange carbon and oxygen. Natural processes can move carbon between reservoirs, but they do not explain the simultaneous long-term pattern of rising CO2, falling O2, declining 13C/12C, and declining radiocarbon.
The four observations reinforce one another:
Rising atmospheric CO2
↓
Declining 13C/12C
↓
Declining 14C
↓
Declining atmospheric O2
Together, these measurements provide a chemical and isotopic fingerprint of fossil-carbon combustion.
Volcanoes do not produce the observed isotopic pattern, and the natural carbon cycle cannot account for the simultaneous changes in the required direction and magnitude.
The molecules carry their own fingerprint—and the atmosphere is preserving the evidence in both carbon and oxygen.
4. How Does Fossil Fuel CO₂ Cause Global Warming?
Through radiative forcing.
Radiative forcing (ΔF) quantifies the change in Earth’s energy balance caused by greenhouse gases: ΔF = 5.35 * ln(C/C0) [W/m² for CO₂]
Where:
- C = current CO₂ concentration
- C0 = reference (pre-industrial) concentration
This logarithmic relationship is experimentally validated and embedded in every modern climate model.
Temperature response follows:ΔT=λΔF
Where λ is the climate sensitivity parameter.
This is not conjecture. It is radiative transfer physics.
5. Is Climate Change Accelerating?
Evidence suggests nonlinear acceleration in multiple coupled subsystems.
Q: How fast is climate change accelerating?
A: Great question. At the time the hypothesis was first developed in the 1990s, observed acceleration rates were closer to ~2^1-fold per century doubling behavior. Today, many major warming-related impacts are doubling on timescales closer to a decade.
In effect, the leading indicators suggest a multi-stage compression of characteristic doubling times, consistent with approximately six successive halving steps (2^6) when comparing early industrial-era timescales with recent decade-scale behavior across multiple indicators.
Multiple climate indicators now point to rates of warming-related disruption far beyond those observed during the modern instrumental era. There is no well-established geological analog for a sustained, multi-variable, decade-scale pattern of accelerating change across the full Earth system at the resolution available in contemporary observations. If sustained, this may represent one of the most abrupt large-scale climate transitions in Earth’s geological history.
Core Mathematical Insight
Feedback Amplification and Doubling Time
When growth processes are governed by feedbacks, the doubling time is:
Td(t) = ln(2) / k(t)
Where:
- Td(t) = doubling time
- k(t) = time-dependent growth constant
- ln(2) ≈ 0.6931
As feedback amplification increases k(t), doubling times decrease.
In systems with little or no feedback, the growth constant is approximately fixed and the doubling time remains relatively stable. In feedback-driven systems, however, k(t) evolves as feedbacks strengthen or weaken over time.
As a result, doubling time becomes a time-dependent quantity rather than a fixed value:
Td(t) = ln(2) / k(t)
When doubling times compress, impacts compound more rapidly, indicating an acceleration of the underlying growth process.
* One scientific nuance: the equation itself is exact for exponential growth at a given instantaneous growth rate k(t). If k(t) changes rapidly, then Td(t) should be interpreted as the instantaneous doubling time at that moment rather than the actual future doubling time of the system.
When doubling times compress, impacts compound rapidly.
Evidence of Nonlinear Acceleration
By the early 2000s, multiple independent datasets showed signs of acceleration:
- SLR (Sea Level Rise) doubling time
- Surface and tropospheric temperature trends
- Greenland and Antarctic ice mass balance loss
- Ocean heat content
- Wildfire frequency and burned area
- Hydrological extremes
Observed impact doubling times appear to have declined from roughly ~100 years in early industrial phases, to ~10 years by 2010 in several indicators, and to ~2–5 years in certain high-sensitivity systems by the mid-2020s.
Under compressed doubling intervals of ~1.5–2 years, cumulative impacts can increase by a factor of:2 to the 6th = 64
within a decade.
That is not linear change.
That is systemic instability driven by reinforcing feedback loops.
Pop Quiz
If you encounter someone disputing anthropogenic climate change, you may offer them the formulas in advance.
Key Equations
1. Doubling Time of Climate ImpactsTd(t)=k(t)ln(2)
2. Radiative ForcingΔF=5.35ln(C/C0)[W/m²]
The Test
- What is the cause of anthropogenic climate change?
- How do humans cause climate change?
- Can anthropogenic global warming be proven? If so, how?
- How does fossil fuel CO₂ cause global warming?
- Is climate change accelerating? What mathematical principle governs the rate of change?
Bonus Question
True or false:
1 + 1 = 2
Climate science is not a belief system. It is an applied branch of physics and nonlinear systems analysis.
The equations are public.
The isotopes are measurable.
The energy imbalance is observable.
Understanding them is optional.
Their consequences are not.
Tipping points and feedback loops drive the acceleration of climate change. When one tipping point is toppled and triggers others, the cascading collapse is known as the Domino Effect.
RESOURCES:
Advanced courses:
Nonlinear Climate Acceleration and the Convergence of Ecofascist and Eugenics Ideologies
The basics:
Climate Change Made Simple: Understanding Feedback Loops and Acceleration
The Nonlinear Acceleration Hypothesis: Easy-Read Format
Chaos Theory Basics (Quick Refresher)